
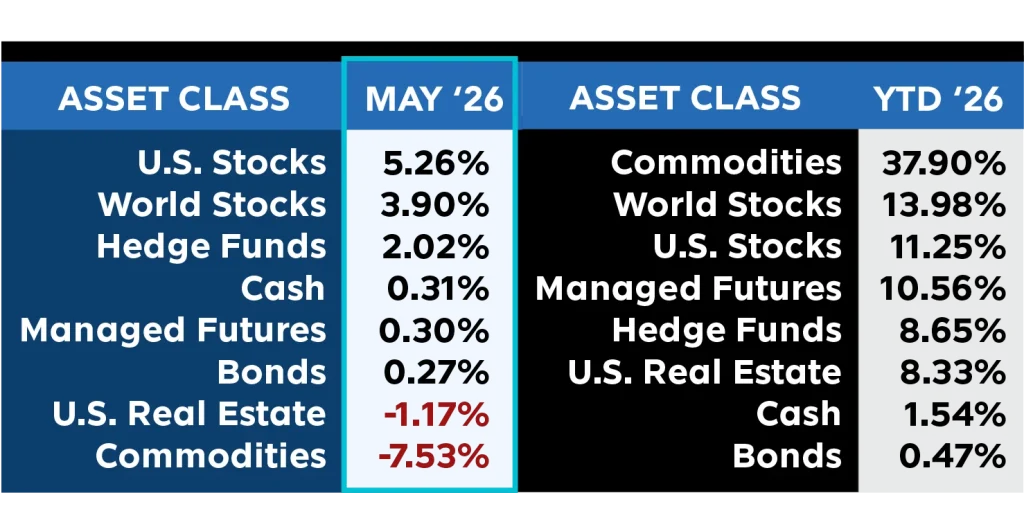
May 2026 saw equity markets continue their upward momentum from April, with U.S. Stocks gaining +5.26% and World Stocks adding +3.90%. U.S. Stocks have now posted back-to-back strong months, pushing their year-to-date return to +11.25%. World Stocks climbed to +13.98% on the year.
Commodities gave back ground in May, falling -7.53% after months of outsized gains. Despite the drawdown, they still hold the YTD lead at +37.90%. U.S. Real Estate also dipped -1.17%, though it remains up +8.33% for the year.
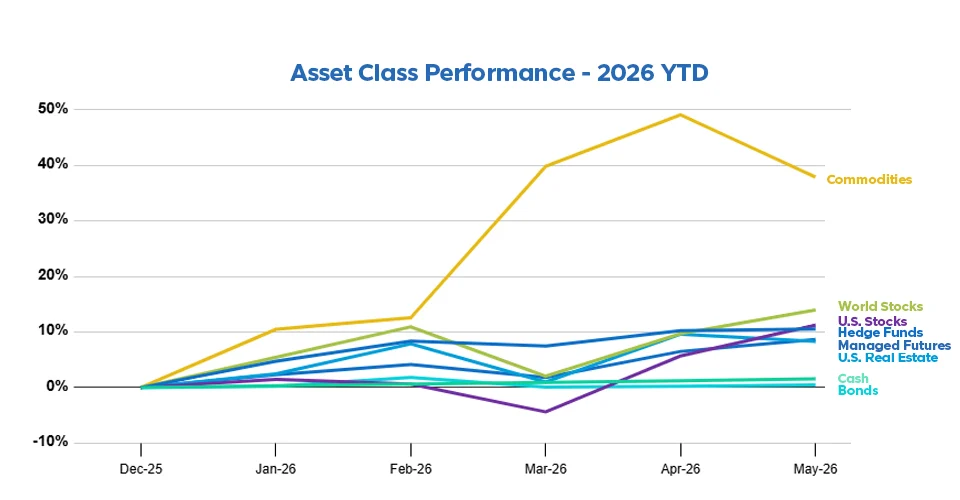
Managed Futures posted a +0.30% return in May, quietly extending their positive streak. They have now delivered gains in four of five months in 2026, with their only negative month being a modest -0.83% in March. Their year-to-date stands at +10.55%, holding fourth place on the scoreboard. While other asset classes have swung between sharp rallies and selloffs, Managed Futures have maintained a steadier path through the year’s volatility.
Hedge Funds gained +2.02% in May, bringing their YTD to +8.65%. Bonds edged up +0.27% and Cash added +0.31%, with both continuing their slow and steady accumulation at +0.47% and +1.54% respectively.
Through five months, all eight asset classes remain in positive territory for 2026. Commodities still lead the pack despite May’s pullback, followed by World Stocks, U.S. Stocks, and Managed Futures.
Past performance is not indicative of future results.
Past performance is not indicative of future results.
Sources: Managed Futures = SocGen CTA Index,
Cash = US T-Bill 13 week coupon equivalent annual rate/12, with YTD the sum of each month’s value,
Bonds = Vanguard Total Bond Market ETF (NYSEARCA:BND),
Hedge Funds = IQ Hedge Multi-Strategy Tracker ETF (NYSEARCA:QAI)
Commodities = iShares S&P GSCI Commodity-Indexed Trust ETF (NYSEARCA:GSG);
Real Estate = iShares U.S. Real Estate ETF (NYSEARCA:IYR);
World Stocks = iShares MSCI ACWI ex-U.S. ETF (NASDAQ:ACWX);
US Stocks = SPDR S&P 500 ETF (NYSEARCA:SPY)
All ETF performance data from Y Charts