We wanted to wait for the dust to settle a little bit before diving into the NASDAQ hitting a new all-time high, and after all – we’ve been waiting 15 years for it to happen, so what’s a few more days. This is sort of like the lady who didn’t train for a marathon finishing 6 hours after the winners. Although nobody shows up to shower her with press, this is a reason for celebration in the financial press! Here’s our quick thoughts on something that took forever to happen.
1. That was Great Depression-like…
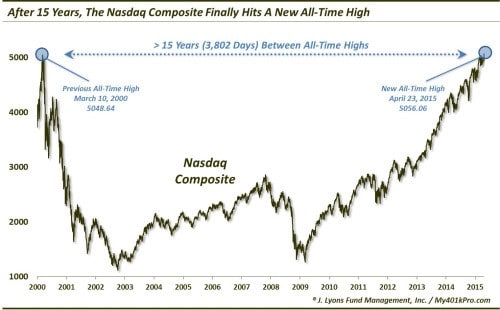
Our friend Dana Lyons had a wonderful post on the NASDAQ hitting new all-time highs for the first time in 15 years, showing that a major US market index (Japan’s 25 years and counting competes if looking globally) hasn’t gone that long between new highs since the Dow Jones took 26 years to recover from the Great Depression. For those counting at home, that’s been 60 years since such an event. Although the event was really the fall, rather than the recovery… but more on that in a bit.
 (Disclaimer: Past performance is not necessarily indicative of future results)
Chart Courtesy: Dana Lyons
The Blue line above is what we in the business call Drawdown Duration. It’s the length of any peak to peak period, or between new all time highs.
2. Would you Invest in this Track Record
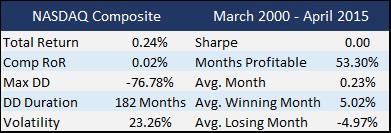
Here’s the Nasdaq over the past 15 years displayed as we would analyze a hedge fund or managed futures program. After all, an index is a sort of trading algorithm (as David Harding said) deciding when to buy when to sell certain assets (all tech stocks in this case).
Would you invest in this trading model after seeing these stats? Would you touch that DD, that Comp ROR?
 (Disclaimer: Past performance is not necessarily indicative of future results)
Data Courtesy: Yahoo Finance
3. Where’s the performance chasing inflows?
Based on the latest statistics reported by the Wall Street Journal, the average investor is thinking this is as high as it’s going to get, at least for now.
“Investors last year pulled a net $11.4 billion from the….Invesco PowerShares QQQ ETF …informally known as the Qubes. It was the biggest outflow in the 16-year history of the fund and the biggest outflow of any U.S. ETF last year.
Even as the Nasdaq kept climbing, investors have pulled out $2.7 billion from the Qubes this year through Friday. By comparison, the ETF that tracks the Nasdaq Composite, called the Fidelity Nasdaq Composite Index ETF, had inflows of $106 million last year and inflows of $75 million so far this year, according to investment-research firm Morningstar.”
The Wall Street Journal suggests that the biggest reason the Nasdaq ETF $QQQ at one point represented 40% of the trading volume at the American Stock Exchange, was because investors wanted to be in on the rise of the tech industry. But as we have previously shown, the NASDAQ is only 58% technology. There’s also healthcare, consumer staples, and more in there. Contrast that with the specialty tech specific ETFs out there today which 80-95% of the ETF invested in tech and you can see an argument for moving into smaller, more focused ETFs. Perhaps that’s what’s going on. Or maybe these type of investors could be just as happy buying and holding $AAPL, $FB, or $TSLA then an index that supposedly makes up tech companies.
4. That straight line up looks eerily familiar
THE NASDAQ JUST CLOSED AT A NEW ALL-TIME HIGH. https://t.co/j9OUE9Bf5c$QQQ$COMPQpic.twitter.com/yQ9doFfemu
— StockTwits (@StockTwits) April 23, 2015
Ignore the near identical vertical accelerations into that peak and this one… and fact that prices plummeted 73% after the last run up like this. This time is sure to be different (wink, wink). Who knows where things go from here. Brian Belski, a chief investment strategist at BMO says, we’re not even close to a bubble.
“Stop with the bubble nonsense,” counters Brian Belski, chief investment strategist atBMO Capital Markets. “Just because prices go up does not mean there is a bubble.”
To have a bubble, Belski says, you need excessive bullish sentiment, excess available credit and “sexy” investment themes, none of which are visible right now.
“This is a bull market where everyone cannot wait to call the top, that’s not a bubble,” Belski says. “People keep doubting Apple and Microsoft and continue to predict their imminent demise. That’s not a bubble.”
But there’s also plenty of people who say this is looking very toppy. CNN Money asks, “Are You Sure There’s No Bubble Lurking in the NASDAQ This Time?”
“After showing major promise, biotech stocks have consistently found a way to let investors down — like in 1986, 1987, 1992, 1994, 1997-98, and pretty much from 2000 to the start of 2009.”
Love him or hate him, Mark Cuban says we’re in a tech bubble worse than 2000.
“If we thought it was stupid to invest in public internet websites that had no chance of succeeding back then, it’s worse today.”
Only time will tell, but surely the odds are greater of a big sell off than they were 5 years ago.
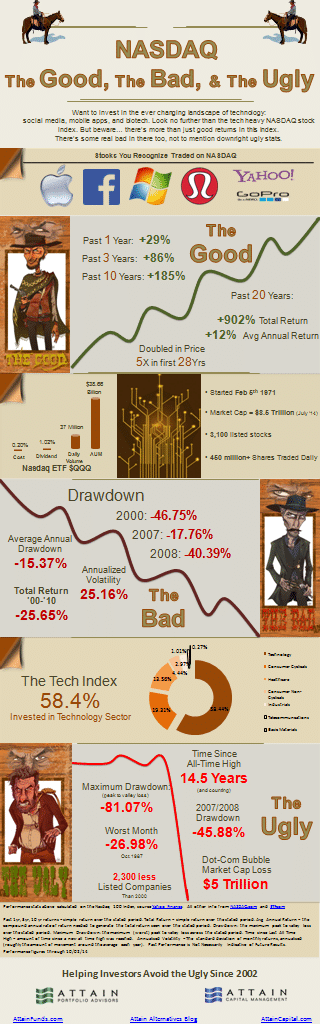
5. Clint Eastwood does the Nasdaq
But enough with words, let’s see how the NASDAQ looks in Clint Eastwood characters…