
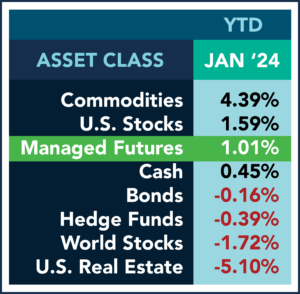
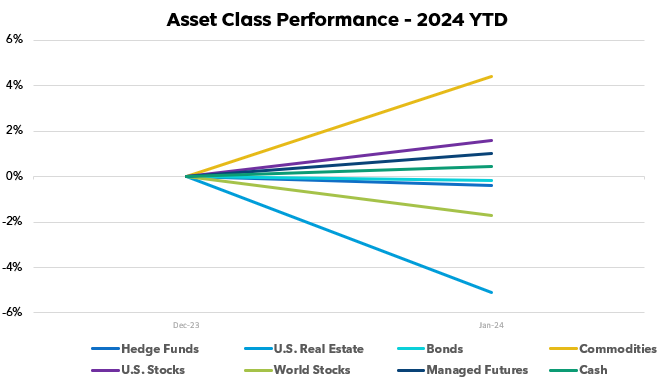
Commodity prices rose to start the new year, with the GSG index gaining a solid +4.39%, supported by tight supply conditions and manufacturing activity. Elsewhere, most assets pulled back as investors adapted to a higher rate of uncertainty globally.
U.S. equities exhibited relative resilience, with the S&P climbing +1.59% after 2023 saw mild gains. By contrast, international shares retreated further by -1.72% on weaker Eurozone data and ongoing geopolitical tensions.
Real estate continued adjustments to monetary shifts, with the IYR real estate index declining -5.10% as property valuations unwound in anticipation of higher mortgage rates. Total bonds fell modestly by -0.16% as Treasury yields rose marginally.
Hedged strategies also pulled back, with the QAI hedge fund index declining by -0.39% as volatility persisted across asset classes to begin 2024. Managed futures captured the upside, returning +1.01% through diversified positioning during market fluctuations.
Going forward, futures’ tactical flexibility to opportunistically take long and short exposures in bullish and bearish conditions may continue offering resilience relative to long-only investments amid ongoing global macro uncertainty. Again, prudent diversification and risk management are always recommended to provide greater stability and stand to benefit as conditions evolve through coming quarters.
Past performance is not indicative of future results.
Past performance is not indicative of future results.
Sources: Managed Futures = SocGen CTA Index,
Cash = US T-Bill 13 week coupon equivalent annual rate/12, with YTD the sum of each month’s value,
Bonds = Vanguard Total Bond Market ETF (NYSEARCA:BND),
Hedge Funds = IQ Hedge Multi-Strategy Tracker ETF (NYSEARCA:QAI)
Commodities = iShares S&P GSCI Commodity-Indexed Trust ETF (NYSEARCA:GSG);
Real Estate = iShares U.S. Real Estate ETF (NYSEARCA:IYR);
World Stocks = iShares MSCI ACWI ex-U.S. ETF (NASDAQ:ACWX);
US Stocks = SPDR S&P 500 ETF (NYSEARCA:SPY)
All ETF performance data from Y Charts