We have a nice graph here showing the longest periods between new highs for five different asset classes. It puts into perspective just how long investors have had to wait in the past until their investments in various asset classes went on to make new highs.
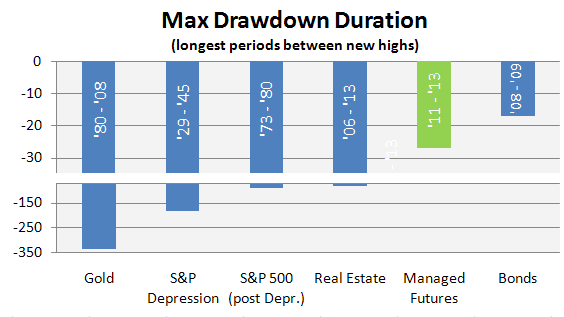
(Disclaimer: Past performance is not necessarily indicative of future results)
Source: Gold data from USAgold.com; S&P Depression data from MorningStar;
S&P 500 (post depr.) data from Yahoo Finance;
Real Estate data from Case Shiller U.S. National Price Home Index;
Managed Futures data from Newedge, Barclayhedge CTA Index, and Dow Jones Credit Suisse;
Bonds data from Fidelity Investment Grade Bond
But that got us thinking… even though the finance world commonly tosses around the word drawdown, does everyone know the difference between the Drawdown figures commonly tossed around (-25%, -12%, etc) and the Drawdown Duration – which is measured in months, not percentages? And even then, are they using the Max Drawdown Duration in the right context? Turns out – the drawdowns experienced by investors have two separate measurements, the magnitude (how much) and the duration (how long), and that when talking Max Drawdowns and Drawdown Durations – while they can occur during the same time, they’re not always the same.
So, what are the two drawdown definitions:
1. How low it goes (the magnitude)
- Putting is plainly, a drawdown is the “pain” period experienced by an investor between a peak (new highs) and subsequent valley (a low point before moving higher).
- Next up, the Maximum Drawdown, more commonly referred to as Max DD. This is pretty much self explanatory, as the Max DD is the worst (the maximum) peak to valley loss since the investment’s inception.
2. How long it lasts… (the duration)
- The Drawdown Duration is the length of any peak to peak period, or the time between new equity highs.
- The Max Drawdown Duration is the worst (the maximum/longest) amount of time an investment has seen between peaks (equity highs).
Here is a graphical example, using the Dow Jones Credit Suisse Managed Futures Index.
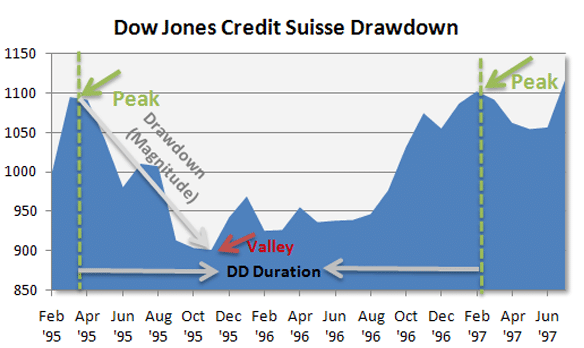
(Disclaimer: Past performance is not necessarily indicative of future results)
Source: Dow Jones Credit Suisse Managed Futures Index
Which brings us to a nuanced point about the max DD duration… many assume that it is the length of time between new highs during which the Max DD (magnitude) occurred. But that isn’t always the case. The Max DD duration is the longest time between peaks, period. So it could be the time when the program also had its biggest peak to valley loss (and usually is, because the program needs a long time to recover from the largest loss), but it doesn’t have to be. Take the DJCS MF index as an example… the –17.74% Max DD had a peak in 03/95, valley in 11/95, and new peak in 02/97 – for a drawdown duration of 22 months. But the DJCS Max Drawdown Duration is not 22 months, it is 28 months – occurring between the 05/11 peak and today.
Why does any of it matter…
Well – while many people check out a program’s Max DD (the magnitude), much less attention is given to the Max Drawdown Duration. It can be argued that the duration of the drawdown is more painful than the magnitude. Sure, nobody wants to be down -17%, for example, but if that is recovered in 6 months time; an argument can be made that it is better than a -5% drawdown which lasts 36 months.
In the end, it is another data point professionals use in analyzing the past performance of investments, and monitoring ongoing performance (with questions like: your current drawdown is 20% longer than any previous, what do you attribute that to.
Finally – we would be remiss if we didn’t share our favorite Drawdown Duration chart…. That would be Japan’s Nikkei stock index, which keeps adding to its Max Drawdown Duration every month, currently at 277 months and counting.

(Disclaimer: Past performance is not necessarily indicative of future results)
Source: MorningStar
As an old associate used to say to our interns upon their starting – I have jeans older than you; and anyone still holding the Nikkei from the 80’s can take solace in the fact they can adjust that saying to tell many young finance professionals – I have Drawdown Durations older than you.