We got a comment the other day from an investor who reads our newsletters, touching on the fees involved with managed futures – something we covered in depth last year after Bloomberg Magazine trotted out a misinformed piece on ‘Futures Fund Fees’ (see our response here) – but we hadn’t seen the question of fees posed quite like this before:
“You wrote an article a while back addressing the critiques of Managed Futures Indices. One area you didn’t address in those articles is the fact that performance numbers are reported gross of fees to those indices. One of the biggest knocks on this space are the high fees involved, so this almost makes the indices useless, one could argue.”
This investor is somehow under the impression that the various managed futures indices are comprised of manager performance numbers gross of fees (that is, not including the usual 2% annual management and 20% of new profits incentive fee), wherever could he have gotten that idea Bloomberg.
To set the record straight – the main managed futures indices are calculated from manager level performance reported NET of fees. Here’s the language from both Newedge and DJCS:
Newedge Language:
“The index calculates the net daily rate of return for a pool of CTAs selected from the largest managers open to new investment.”
DJCS Language:
“Does the Credit Suisse Hedge Fund Index use net or gross data?
Performance data used in the index is net of all fees. “
We’ll even take it a step further and tell you that NFA and CFTC regulations require managed futures managers registered as CTAs and CPOs to report their performance NET of fees, and that the overwhelming majority of managed futures programs which report to the indices are of a size where they use a third party accounting firm or ‘administrator’ to calculate their monthly performance numbers, insuring the correct deduction for accrued fees, any additions and withdrawals, and so on. It’s actually quite hard for a manager to ‘back out’ the fees and arrive at a gross performance number.
Now… what isn’t included in the performance reported to the indices are any additional fee layers which may be added on for a feeder fund or similar such access point to a manager. For example, we recently assisted a client of an Advisor we work with move over to an Attain fund from their investment in something called the Winton Direct fund. The client assumed, like the reader mentioned above, that the reason he was up just 5% in his “Winton” investment over the past 5 years while Winton’s stated performance was +29% over the same time – was because Winton was reporting their performance gross of fees.
But that isn’t the case… Winton is reporting net of fees just like they’re supposed to and just like everyone else. The 25% difference between the investor’s returns and Winton’s reported returns isn’t due to a gross vs net problem – it was the investor’s access point, coming in through a big broker/dealer which was charging an additional 5% a year for the access. Maybe that’s an acceptable price to pay for access to the ‘Blue Chip’ manager of the managed futures space IF they are returning 25% per year. But when they are doing only 6% per year (NET of their fees), and you are paying 5% extra to access that 6% return – the numbers stop making sense in a hurry.
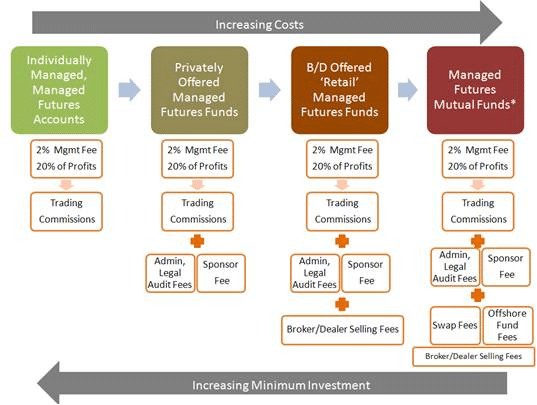
For a reminder on the various access points to managed futures and the layers of fees involved – here’s our handy chart breaking it down. This can also show you how the indices can be net of fees, but not net of ALL possible fees. The managed futures indices are typically calculated from performance numbers reported after the first and second access points (the managed accounts and manager offered funds), not after the distributors (B/Ds and mutual fund wholesalers) have gotten their hands on them.