 (Disclaimer: past performance is not necessarily indicative of future results)
 (Disclaimer: past performance is not necessarily indicative of future results.)
Source: All ETF performance data from Morningstar.com
Sources: Managed Futures = Newedge CTA Index, Cash = 13 week T-Bill rate
Bonds = Vanguard Total Bond Market ETF (BND),
Hedge Funds= IQ Hedge Multi-Strategy Tracker ETF (QAI)
Commodities = iShares GSCI ETF (GSG); Real Estate = iShares DJ Real Estate ETF (IYR);
World Stocks = iShares MSCI ACWI ex US Index Fund ETF (ACWX);
US Stocks = SPDR S&P 500 ETF (SPY)
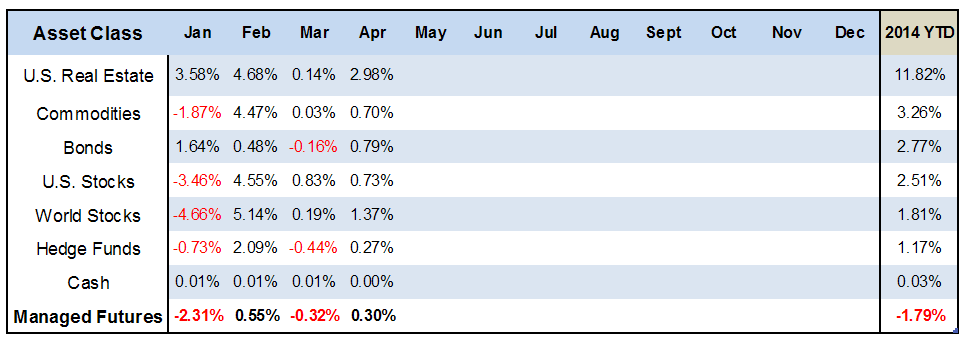
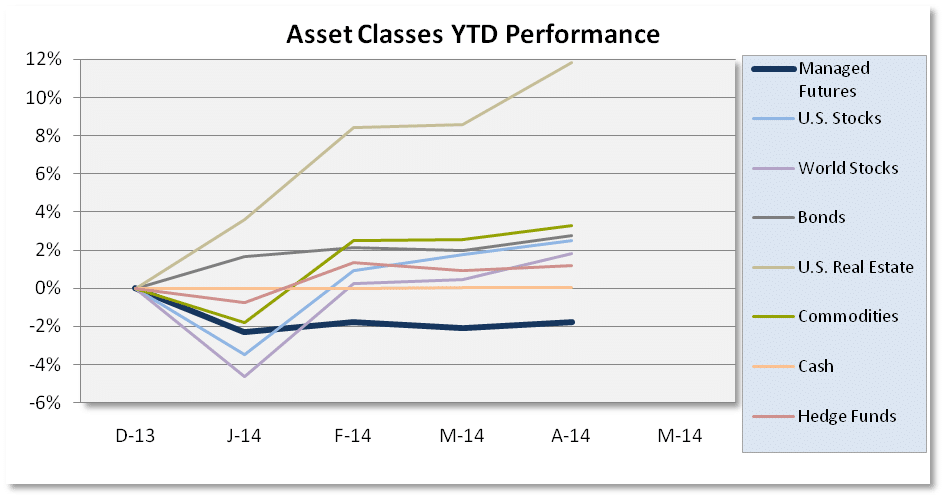
Much like February, April performance for the asset classes we track all ended in the positive (which is traditionally a rare occasion), but it’s Real Estate with the only substantial gain worth mentioning up almost 3%. Maybe it’s random, maybe it was a plan, but it just so happens that Doubleline’s Gundlach came out with a call to short the housing market just this week.
There’s been quite a bit of chatter on Real Estate for this reason, so we decided to dig a little deeper on the return driver for Real Estate, and it turns out that Home Sales are only doing well with purchases costing more than $1 Million, while home sales of value of 250,000 or less struggled heavily, via The National Association of Realtors.
“Purchases costing $1 million or more rose 7.8 percent in March from a year earlier, according to data released last week by the National Association of Realtors. Transactions for $250,000 or less, which represent almost two-thirds of the market, plunged 12 percent in the period as house hunters found few available homes in that price range.”
This calls into question what type of exposure you might have to Real Estate, the ones connected to the luxury homes, or the majority of the market. While the Real Estate ETF $IYR is up almost 12% on the year, the homebuilders ETF, $XHB, is down 8% {past performance is not necessarily indicative of future results}.
This same question can be asked for those exposed to stocks through ETFs. Of the four stock indices (S&P, Dow Jones, Nasdaq, and Russell), only one of the ETF’s are positive on the year, that’s SPY up 2.51%. The others are down (DIA down -0.31%, QQQ down -1.94%, IWM down -8.02%) {past performance is not necessarily indicative of future results}.
Bottom line – an index (or ETF) tracking an asset class does a good job of giving you the big picture, but it doesn’t provide the full detail.