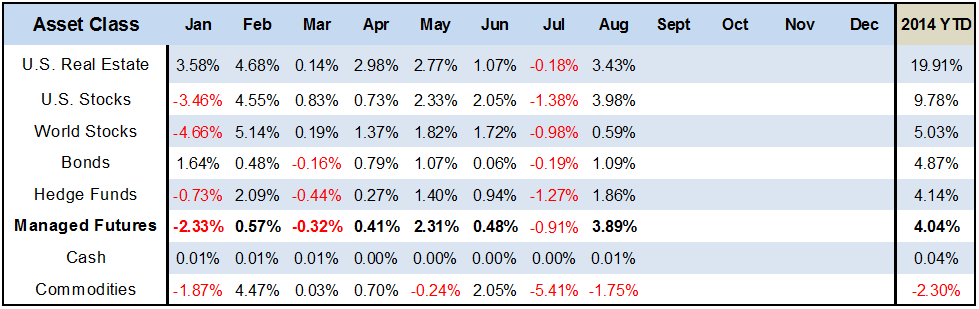
Everyone down, now everyone back up (except you commodities…). Seems like everything has been moving in tandem of late, with everything reversing their July losses for gains in August. Except commodities, which remain the lone asset class down on the year. And meanwhile, managed futures has been hanging in there pretty well given how poor of an environment it’s been with the ultra-low volatility. {past performance is not necessarily indicative of future results}.

(Disclaimer: past performance is not necessarily indicative of future results)
Source: All ETF performance data from Morningstar.com
Sources: Managed Futures = Newedge CTA Index, Cash = 13 week T-Bill rate
Bonds = Vanguard Total Bond Market ETF (BND),
Hedge Funds= IQ Hedge Multi-Strategy Tracker ETF (QAI)
Commodities = iShares GSCI ETF (GSG); Real Estate = iShares DJ Real Estate ETF (IYR);
World Stocks = iShares MSCI ACWI ex US Index Fund ETF (ACWX);
US Stocks = SPDR S&P 500 ETF (SPY)