If you’re already a Futures market guru, enjoy the rest of your day. Nothing to see here. But for those who might not consider themselves experts, here’s some insight into how a futures market trader, or really anyone who knows 1. There’s more than one “market” and 2. There’s more than one side to the “markets”; looks at the markets.
First, we’ll go backwards a little bit and show you how professional traders don’t look at the market. Here’s how you’ll usually see a list of markets or other investments listed in the Wall street Journal or whatever financial source you’re used to…
Futures Market “Winners and “Losers” of 2014 YTD
(All data taken from Finviz. Performance as of 10/22/2014)
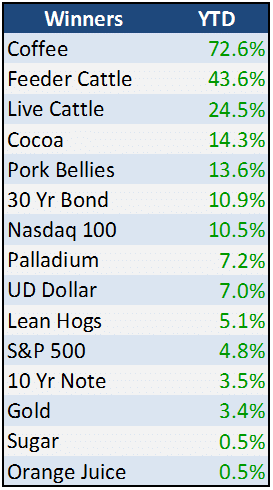
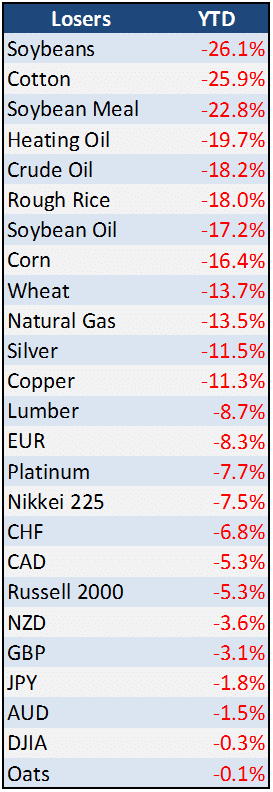
At first glance, it appears that over half (62%) of the futures markets have negative performance on the year. Alternative investments operating in the futures markets must be getting crushed, or at least struggling, right? Would it surprise you to know that Managed Futures is coming off of its best quarter since 2008. How can that be? Here’s one more look at the futures market performance numbers in chart format.

To a pro – this is a really weird way to look at the markets, even though they’ve trained their brains over the years to read these charts in their own manner. They understand that the majority of investors out there are likely long stocks, bonds and mutual funds; and in that world – if the price moves up, your investment in that item is making money, and if down, you’re losing money. But for a professional trader – the concept of winning when the market rises and losing when it falls is an odd one. That happens from time to time, but they also know the feeling of winning when the market falls and losing when it rises.
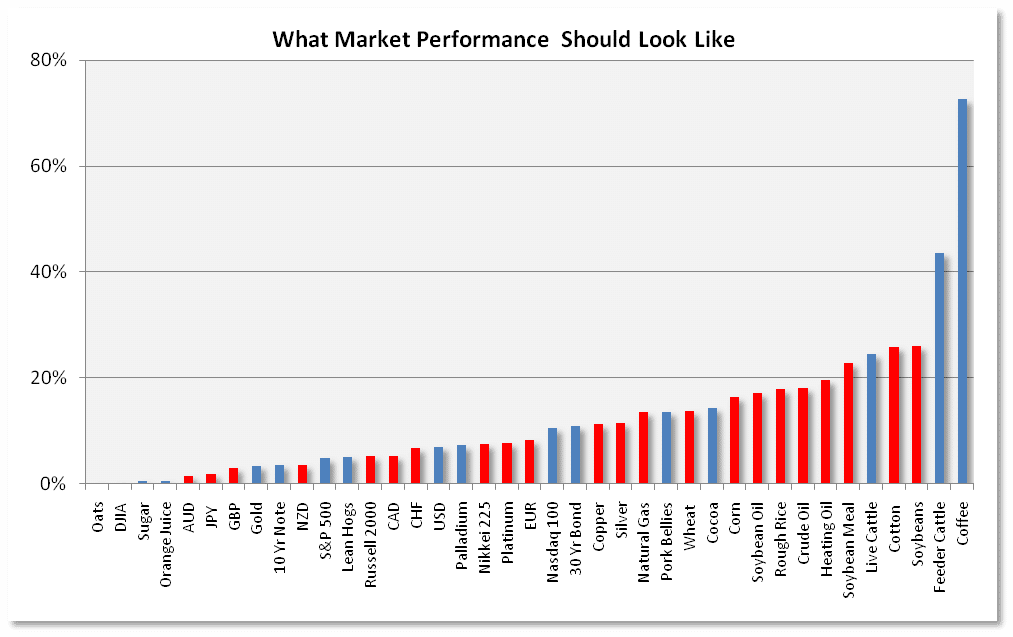
So when a pro looks at how markets have done that day, or that year, or what have you – it’s completely dependent on whether they are holding that market long or short, and over what time frame. For a short term strategy, they may make or lose 15% in a year on a market that ends up the year up 0.50%. For a longer term strategy doing typical trend following type stuff, it isn’t so much whether the market is up or down – but how much it is up or down.
For those in longer term systematic programs, like these, the YTD market chart looks something more like this:
 (Disclaimer: Past performance is not necessarily indicative of future results)
[Tweet “For them – it’s about the absolute value of the move, not the direction of the move”].
For them – it’s about the absolute value of the move, not the direction of the move. Systematic guys are directionally agnostic (hey, that would be a great boat name). Their not betting on prices rising or falling, nor rising or falling a certain amount. They are betting on being able to ride a rise or a fall for a long enough time to offset (and some) any losses seen getting into false moves up and down.