
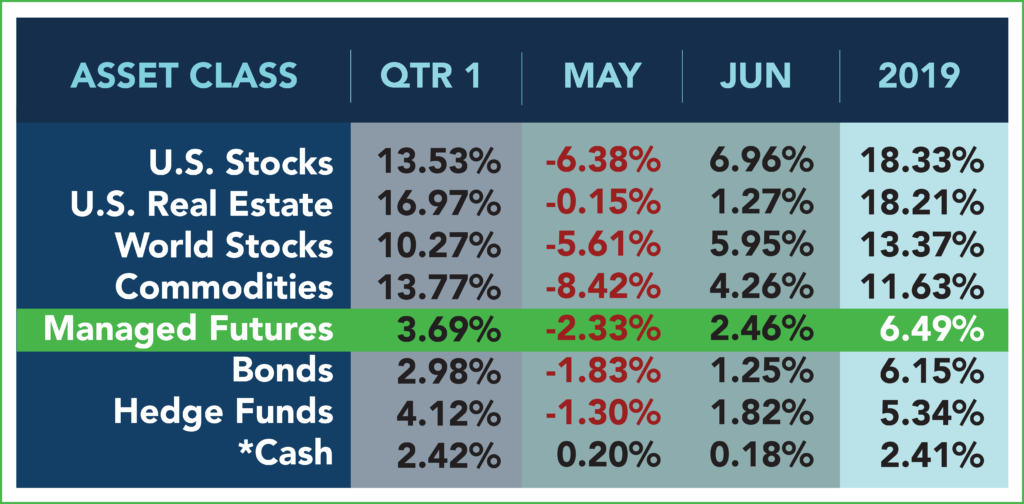
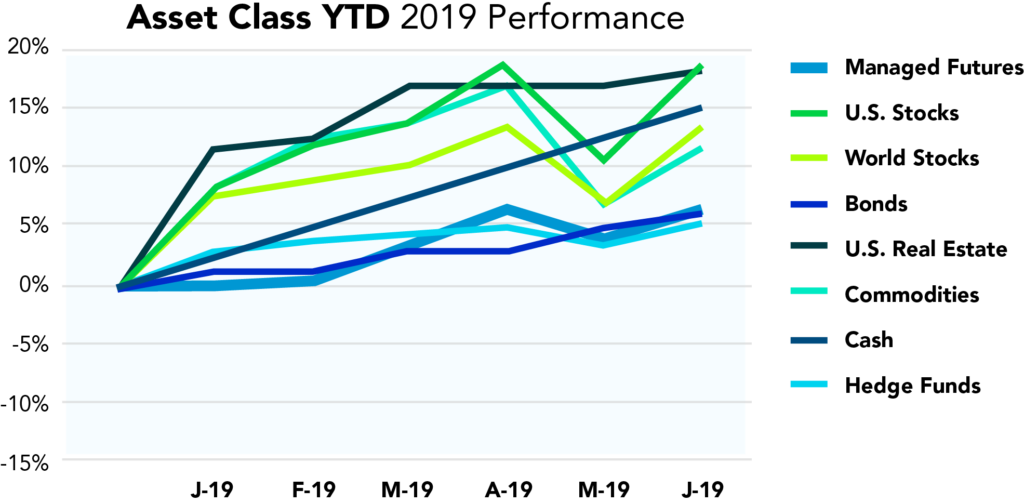
It’s like someone put a mirror between asset classes in May and June – with most asset classes performing nearly the exact opposite side of their percentage from the month before. Low volatility continues to persist (as we had suggested at the beginning of the year) bringing in big positives across the board after the half-year check point. Not to mention that we’re a far cry from the perpetual single-digit returns that we were holding onto last year at this time. Managed futures was able to bounce back this month with a +2.46%, and a total +6.49% for the year, while US stocks and real estate continue their high wire act.
Past performance is not necessarily indicative of future results.
Past performance is not necessarily indicative of future results.
Sources: Managed Futures = SocGen CTA Index,
Cash = US T-Bill 13 week coupon equivalent annual rate/12, with YTD the average of each month’s value,
Bonds = Vanguard Total Bond Market ETF (NYSEARCA:BND),
Hedge Funds = IQ Hedge Multi-Strategy Tracker ETF (NYSEARCA:QAI)
Commodities = iShares S&P GSCI Commodity-Indexed Trust ETF (NYSEARCA:GSG);
Real Estate = iShares U.S. Real Estate ETF (NYSEARCA:IYR);
World Stocks = iShares MSCI ACWI ex-U.S. ETF (NASDAQ:ACWX);
US Stocks = SPDR S&P 500 ETF (NYSEARCA:SPY)
All ETF performance data from Morningstar.com