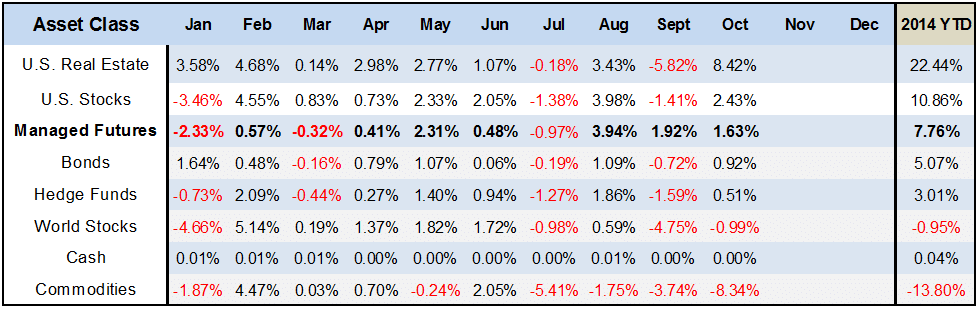
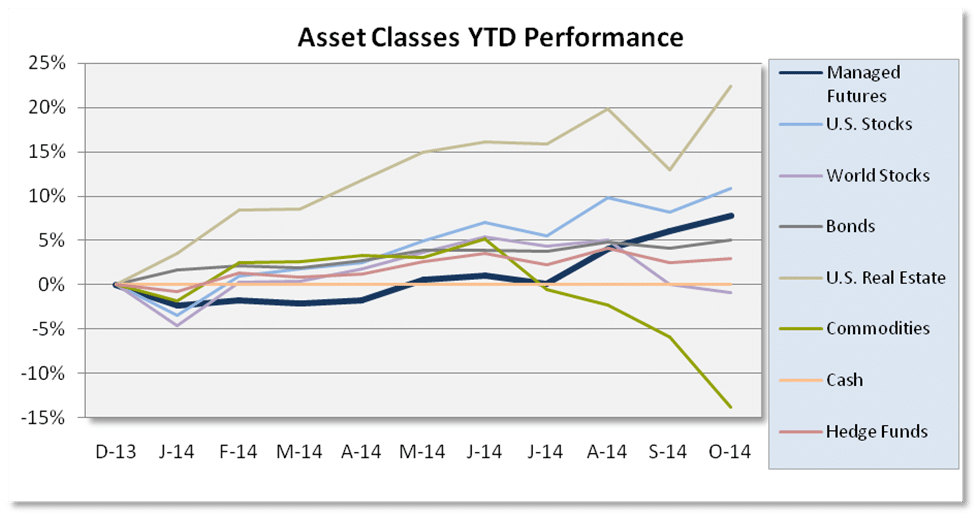
The month’s Asset Class Scoreboard numbers is a perfect example of just how much noise is out there in the markets. If you were glued to your twitter feed in October, you may have been freaking out about the -5% drop, but someone who checks in monthly doesn’t even see it… October finished just fine for them after a somewhat rare stock market bounce.
And then there’s managed futures, which somehow amidst all the ‘trend following is dead’ commentary and articles about Paul Tudor Jones losing money – posted its third consecutive month of gains, and 6th out of the past 7 months, to find itself sitting in third place on our YTD scoreboard. Of course, this is an index, not all managed futures programs are up. But just the same, it sure is nice to be around the upper tier for a while after spending most of the past few years towards the bottom.
PS – take a look at the buy and hold commodities trade, down double digits on the year as Crude Oil joined the commodity sell off in October, to join grains and metals which had done so in the month’s prior.
 (Disclaimer: past performance is not necessarily indicative of future results)
Source: All ETF performance data from Morningstar.com
Sources: Managed Futures = Newedge CTA Index, Cash = 13 week T-Bill rate
Bonds = Vanguard Total Bond Market ETF (BND),
Hedge Funds= IQ Hedge Multi-Strategy Tracker ETF (QAI)
Commodities = iShares GSCI ETF (GSG); Real Estate = iShares DJ Real Estate ETF (IYR);
World Stocks = iShares MSCI ACWI ex US Index Fund ETF (ACWX);
US Stocks = SPDR S&P 500 ETF (SPY)