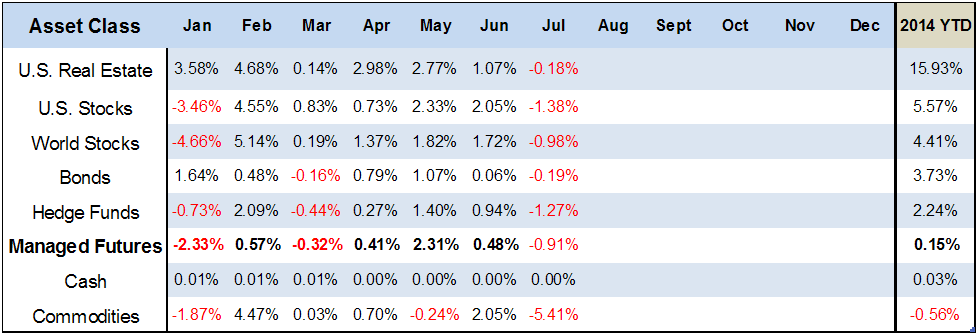
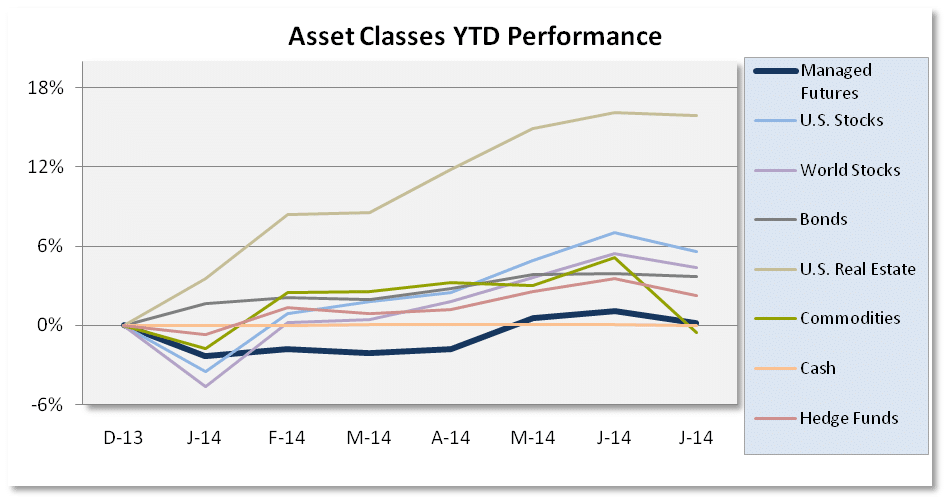
Well that was a lot of red in July, with all of the asset classes we track showing negative performance behind stock markets’ first losing month in the past six. The big loser, commodities, which fell over 5% as energy markets sold off and the big sell off in grains through the month of July, making Commodities the only asset class negative on the year.
 (Disclaimer: past performance is not necessarily indicative of future results)
Source: All ETF performance data from Morningstar.com
Sources: Managed Futures = Newedge CTA Index, Cash = 13 week T-Bill rate
Bonds = Vanguard Total Bond Market ETF (BND),
Hedge Funds= IQ Hedge Multi-Strategy Tracker ETF (QAI)
Commodities = iShares GSCI ETF (GSG); Real Estate = iShares DJ Real Estate ETF (IYR);
World Stocks = iShares MSCI ACWI ex US Index Fund ETF (ACWX);
US Stocks = SPDR S&P 500 ETF (SPY)