We looked at the asset class scoreboard from a longer term perspective earlier this week, checking out how the various competing (or complimentary depending on your view of diversification) asset classes had done in the 5 years before March 9, 2009 and the 5 years after March 9, 2009 in a post that went semi-viral due to the revelation that all the asset classes basically swapped places after the 10 year game’s halftime on March 9, 2009.
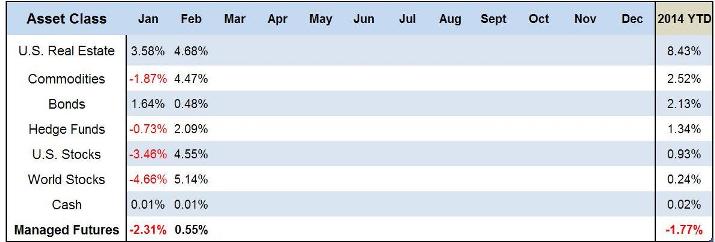
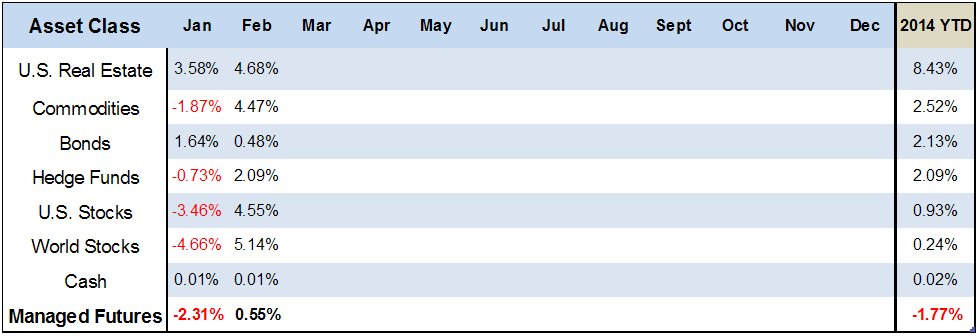
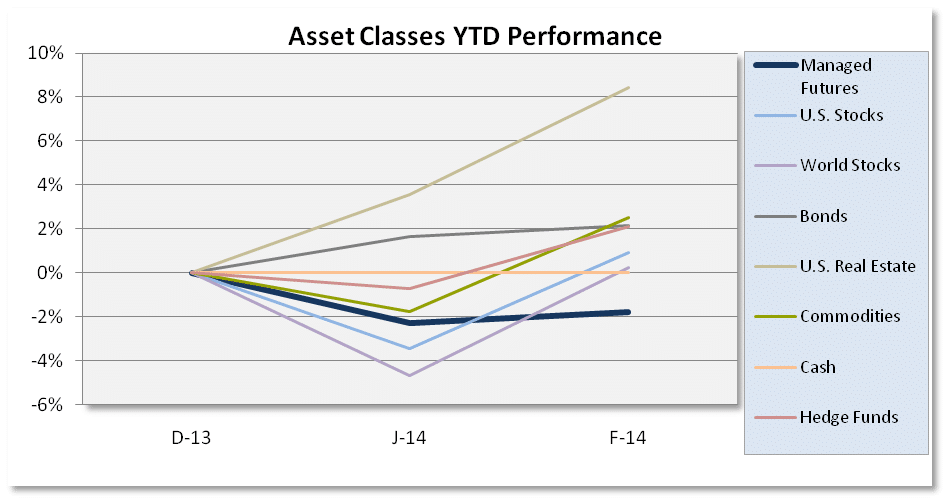
And now here’s our usual monthly look at the scoreboard, after the February numbers for everything we track are finally in.
(Disclaimer: past performance is not necessarily indicative of future results)
 (Disclaimer: past performance is not necessarily indicative of future results.)
Source: All ETF performance data from Morningstar.com
Sources: Managed Futures = Newedge CTA Index, Cash = 13 week T-Bill rate
Bonds = Vanguard Total Bond Market ETF (BND),
Hedge Funds= IQ Hedge Multi-Strategy Tracker ETF (QAI)
Commodities = iShares GSCI ETF (GSG); Real Estate = iShares DJ Real Estate ETF (IYR);
World Stocks = iShares MSCI ACWI ex US Index Fund ETF (ACWX);
US Stocks = SPDR S&P 500 ETF (SPY)
That’s a rarely seen octuple, with all 8 asset classes posting positive performance in February, and all but managed futures positive on the year. C’mon managed futures … get in the game!