Discussing the AUM of the managed futures industry can be tricky. It’s a topic we’ve been conjuring for a while now, and there are multitudes of things to consider before arriving at a number that truly represents the industry. It’s this very reason that we are reading conflicting reports of 2013 AUM and asset flows for Managed Futures. First, AI CIO writes that as a whole, managed futures AUM is down to it’s lowest point since 2007.
“For managed futures, however, outflows not only surpassed those from macro strategies but were more than double the outflows of all other asset-losing strategies combined. At $143.8 billion, AUM for the struggling sector is at its lowest since 2007. Even the rare managed futures funds with positive performance in 2013 tended to lose investor capital. While investors dumped their commodity trading advisors (CTAs) across the board, they primarily pulled money from those macro managers who had underperformed—assets that may return to the strategy under new management.”
Those numbers are considerably different from Barclayhedge’s CTA AUM statistics, which were recently updated.
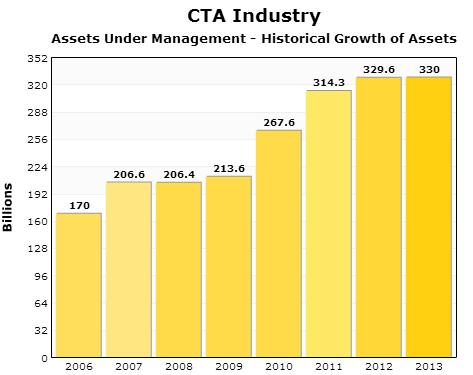
“Commodity trading advisors (CTAs) funds took in $438 million (0.1% of assets) in December, the first inflow after redeeming $5.1 billion over the previous three months. CTAs took in $1.1 billion in 2013, their annual lowest inflow in our records dating to 2001, down dramatically from $12.1 billion in 2012 and $46.4 billion in 2011.”
This brings the 2013 Managed Futures AUM to $330 Billion according to Barclayhedge.
 (Disclaimer: Past performance is not necessarily indicative of future results)
Source: Barclayhedge
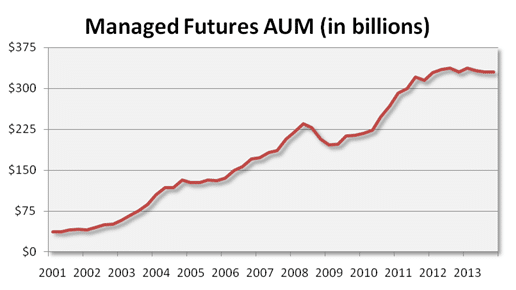
And a look at the Managed Futures AUM dating back to 2001.
 (Disclaimer: Past performance is not necessarily indicative of future results)
Source: Barclayhedge
We’re not here to say which one is right or wrong, because it all depends of the parameters set of which managers should be included. For instance, is it appropriate to add Bridgewater, the largest Hedge Fund in the world (having little to do with managed futures?)
It would make logical sense to see investors leave the space like AI CIO states after posting mediocre returns. Outflows are to be expected in any asset class struggling – that’s the very definition of performance chasing. However, an outflow of funds like this is just the thing we saw right before entering crisis period performance back in 2008…. and the same we saw in stocks in 2009, or bonds at the beginning of this year. The asset class losing the money usually sees the best performance in a sort of real life/real money Murphy’s Law. {past performance is not necessarily indicative of futures results}.
But if we chose to see the Managed Futures asset story through the lens of Barclayhedge, we’re elated to see investors are still choosing to allocate to managed futures given its flat performance of late, even if it’s the slightest of gains in AUM in December:
 (Disclaimer: Past performance is not necessarily indicative of future results)
Source: Barclayhedge
In the end, the flows usually follow the following chart pretty well, with money coming into an asset class pretty close to the ‘point of maximum financial risk’ on the emotions cycle chart below, and flowing out again down there at the bottom of the emotion cycle, at the ‘point of maximum financial opportunity’.

P.S. Here’s our previous post on Managed Futures AUM
1.” Managed Futures: $300 Billion and Counting”
2. “Is the Size of the Managed Futures Industry Inflated by 56%?”
3. “What Everybody Ought to Know About Managed Futures Asset Class Growth”
![]()