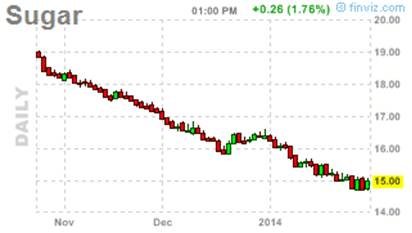
With metals, energies, stock indices, and grains representing the majority of the trading in the futures space, sometimes the Soft markets get, well… ignored. Our last look at the softs markets was when sugar was showing a certain mountain type shape, not knowing where it would go from there.
But since then, Sugar has continued its slope, down 24% since October with 50 out of the past 70 days down, and now at its lowest point since 2010 (although up a little today) {disclaimer: past performance is not necessarily indicative of future results}.
 (Disclaimer: Past performance is not necessarily indicative of future results)
Chart Source: Finviz.com
The reasons for the down move aren’t that people are no longer asking for sugar in their coffee or switching to Splenda (what happened to the War on Sugar), but that the big three sugar producers: Brazil, Thailand, and India are expected to outpace demand by 4.7 metric tons come September. That’s led to a lot of people piling in on the short side of this trade, as evidenced by the CFTC commitment of traders data via the Wall Street Journal.
“Money managers have been increasing their bets that raw-sugar prices would continue to fall. In the week ended Jan. 21, those bets outweighed wagers that prices would rise by the largest margin since July, according to the latest data from the Commodity Futures Trading Commission.”
But is there more than just supply and demand at work here? After all, back in October, one of Brazil’s largest sugar companies lost 180,000 tons of sugar in a fire (10% of Brazil’s export in a month), and the markets didn’t even flinch. So, how is it that a majority of traders in the sugar market are short positions? Yes, 4.7 tons is quite a bit more sugar than expected, but is there another factor at play?
Well, it just so happens that Brazil produces 25% of global production and 50 percent of world exports, and their economy (currency) is in a bit of a tight spot, after the fed’s decision to taper.
“Weakening currencies in Brazil and other large sugar producers also are expected to encourage exports, which could add to already robust supplies, said Michael McDougall, a senior vice president at brokerage Newedge.
When currencies in sugar-exporting countries weaken against the U.S. dollar, producers there often choose to export their crop because they would receive more of their local currency back for product sold abroad in dollars.”
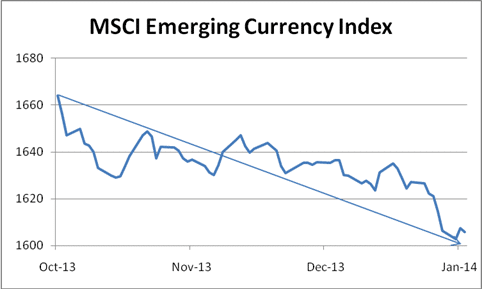
A quick peek at the MSCI Emerging markets currency index shows a pretty similar down trend to Sugar, making the Sugar trade a sort of synthetic emerging markets short trade for all those who were complaining their managers weren’t short the Turkish Lira or Argentine Peso (those are so thinly traded, not many managers play in that space).
 (Disclaimer: past performance is not necessarily indicative of future results)
Source: MSCI
So, combine a lot of global supply with Brazilian Sugar farmers more willing to sell their Sugar for Dollars than their falling currency, and you have a classic down trend of your hands. Whatever the reason, it’s just the sort of trend most managed futures programs like to identify and ride out as long as they can. And many futures traders and CTA’s alike have caught on: including Covenant Aggressive, Brandywine Symphony, Sona Trading, Auctos Global Diversified, Integrated Managed Futures, and Clarke Worldwide.
How do they do it? Magic? Nope. Boots on the ground in Brazil analyzing the crop? No sir. They do it by tracking markets like sugar and entering into a short trade when the market breaks below its 20 day low, 200 day moving average, lower Bollinger band, and so forth. They do it by being wrong a lot when the market has a false breakout, in order to be right when the market keeps going that direction.