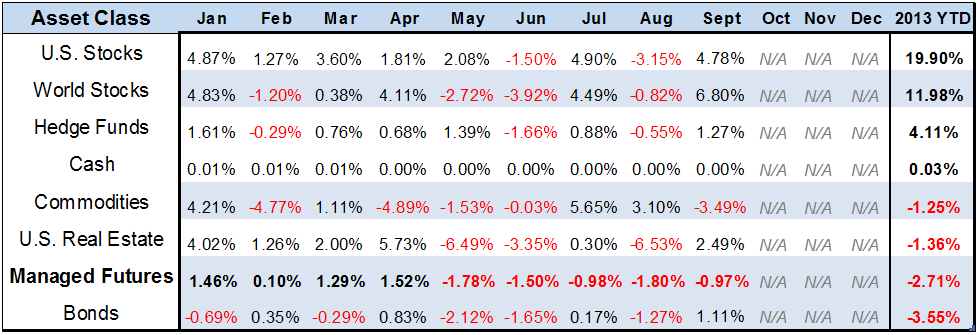
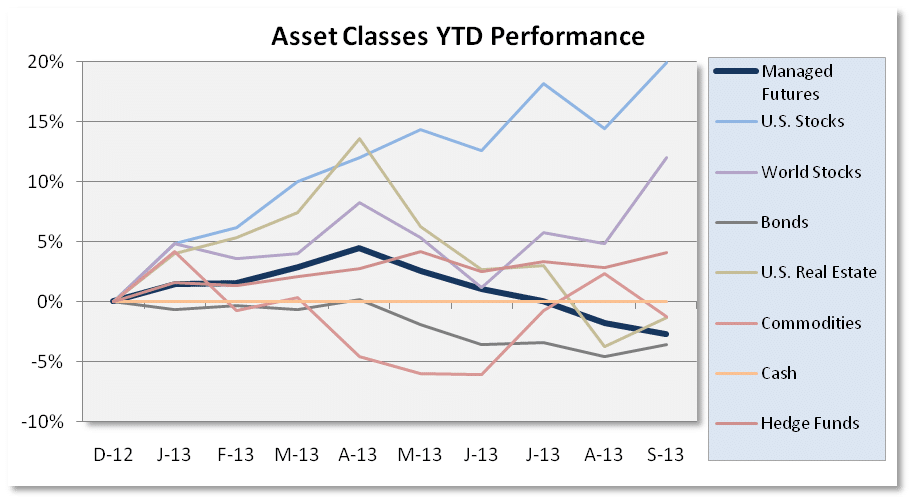
How are asset classes looking Year To Date? Both U.S. Stocks and World Stocks surged in September to remain at the top of the scoreboard. Meanwhile, Managed Futures continues to slip lower in the rankings, now 2nd to last, only above Bonds (are people saying Bonds are broken and don’t work anymore?). Elsewhere, buying and holding Commodities isn’t fairing well; with September’s numbers bringing it back into the red, while real estate (at least by our measure) remains down for the year.
(Disclaimer: Past performance is not necessarily indicative of future results)
 Disclaimer: past performance is not necessarily indicative of future results.
Sources: Managed Futures = Newedge CTA Index, Cash = 13 week T-Bill rate,
Bonds = Vanguard Total Bond Market ETF (BND), Hedge Funds= DJCS Broad Hedge Fund Index;
Commodities = iShares GSCI ETF (GSG); Real Estate = iShares DJ Real Estate ETF (IYR);
World Stocks = iShares MSCI ACWI ex US Index Fund ETF (ACWX); US Stocks = S&P 500