A great day for our weekly chart of the week when we pull up our twitter feed and see charts like these featured on a Business Insider article titled, “Wall Street’s Brightest Minds Reveal THE MOST IMPORTANT CHARTS IN THE WORLD.”
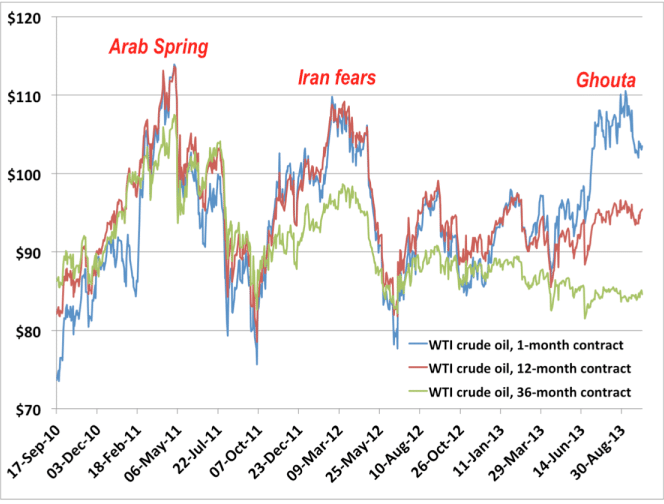
The first observes Crude Oil contracts through the lens of placing 3 different contracts (1-month, 12-month, and 16 month contracts) side by side. It appears as though the three are correlated through previous event risk situations such as the Arab Spring, and Iran fears, but then moves in different directions during the chemical weapons attack in Syria.
 (Disclaimer: Past performance is not necessarily indicative of future results).
Chart Courtesy: Business Insider
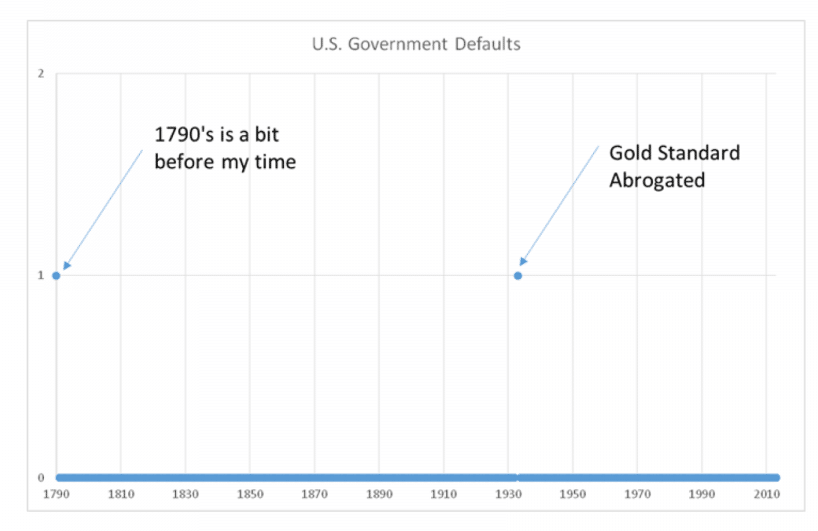
The second chart goes back to the birth of our nation to see previous U.S. debt defaults. However, Peter Tchir, founder of TF Market Advisors explains that while there has been much anticipated negative hype surrounding this round of debt ceiling talks, it’s not different from any other debt ceiling debate. If you want more information on the recurring debt debate, the award winning TV show “The West Wing” explains in less than a minute why these debts are both routine and end of the world scenarios.
 (Disclaimer: Past performance is not necessarily indicative of future results)
Chart Courtesy: Business Insider